Housing Valuation Methods
In the long run, home price increases can not outpace median household income. It is for this reason that variations of two valuation methods have traditionally been used by economists. One method compares home prices to household income (price/earnings), and the other method compares home prices to rent (price/rent).
The first chart below represents price/earnings ratios, and was compiled for this page by simply dividing median U.S. house prices by median household income, both from the U.S. Census Bureau. It covers the years 1967 through 2nd quarter 2005. (Note: 2004 and 2005 median household income was estimated based on percentage gains of personal income as provided by Economagic.com.)
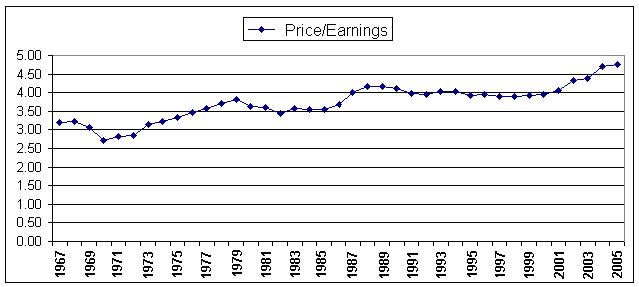
Figure 1. Median Sales price of U.S. Homes Divided by Average Household Income.
Note. Median sales prices where averaged from all 12 months as stated from U.S. Census Bureau (2004, August). Median and Average Sales Prices of New Homes Sold in United States. Retrieved September 5, 2005 from http://www.census.gov/const/uspricemon.pdf
Note. Median household income for 1967-2003 was taken from the “Third fifth” column of U.S. Census Bureau (2004, August). Historical Income Tables – Household, 2005. Retrieved September 5, 2005 from http://www.census.gov/hhes/income/histinc/h03ar.html
Note. 2004 and first two quarters of 2005 household income were estimated by calculating annual percentage increase of personal income from Economagic.com (2005). Personal Income. Retrieved September 7, 2005 from http://www.economagic.com/em-cgi/data.exe/nipa/T2t1l1q
The second chart (figure 2) represents price/rent ratios and was compiled by John Krainer for the Federal Reserve Bank of San Francisco. The table refers to the US as a whole (not San Francisco). The Chart was published on October 1, 2004; ratios of price/rent are certainly higher now.
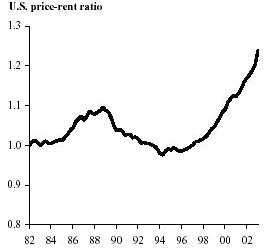
Figure 2. Price-Rent Ratio
Note. From Krainer, J. (2004, October). House prices and fundamental value. Retrieved September 30, 2005, from http://www.frbsf.org/publications/economics/letter/2004/el2004-27.html
Different Housing Markets; Different risks
The national market is certainly higher than historical averages as shown in figure one and two, but it is very important to understand that different markets have very different valuations and therefore different risks associated with them. Consider the following two studies; each study comes from two very reputable sources.
National City Study
Richard Dekaser, Chief Economist for National City, a mortgage lender, has issued a widely cited study that highlights valuations in 299 local metropolitan markets. Dekaser's (2005) study is very unique, in that it analyzes long term statistics from 1985-2005 in the 299 local markets he studies. His study is based on price/earnings and other local factors. Listed below in table 1 is a list of 53 markets “representing 31 percent of the total U.S. housing market” (p.1) that DeKaser considers overvalued by 30% or more.
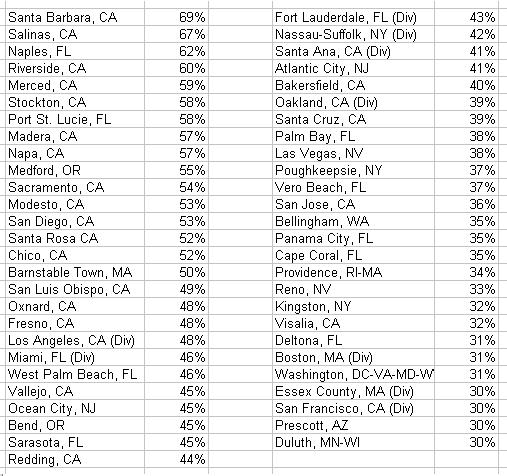
Table 1 From DeKaser R. (2005, July). House prices in America: Valuation methodology & findings. Retrieved September 20, 2005 from http://www.nationalcity.com/content/corporate/EconomicInsight/documents/finalreport.pdf
Markets overvalued by 30% or more where chosen by DeKaser “(…) based on a review of actually observed price corrections over the past 20-year history.” (p.3) DeKaser actually analyzed 63 past corrections of 10% or more that occurred over a period of 8 quarters or more in local markets. He notes that:
- “The median, or typical price correction is 17%”(Appendix IV)
- “The median, or typical, degree of overvaluation prior to a correction is 30 percent.” (Appendix IV)
- “The more severe the overvaluation, the greater the subsequent declines tended to be …” (Appendix IV)
- “The more severe the overvaluation, the shorter the duration [of price correction] tended to be …” (Appendix IV)
PMI Group Study
For an objective look at local market conditions, Akkeraen & Ogishi have also done a very interesting study, this one for the PMI Group. The study rates the 50 largest housing markets in the United States. According to this study “… the nation’s 50 largest markets now have on average a 21.3% chance of experiencing a decline in house prices over the next two years” (2005, p.3). Keep in mind that this report was compiled with first quarter 2005 housing price data; National housing prices have since continued to rise faster than national income.
Akkeraen & Ogishi calculated, at the time, that six of fifty markets had a greater than 50% chance of decline in the succeeding two years. Similar to Dekaser’s study, some markets are considered much riskier than others. The author's Risk Index rates each individual market by what they calculated to be the percentage chance of a decline in the next two years (e.g. 200 = 20%, 300 = 30%, etc.). Listed below in table two are the markets they considered to have a 20% or larger chance of decline in the two years succeeding the study.
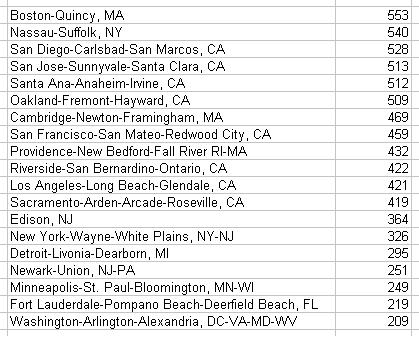
Table 2
From Akkeraen, M.V., & Ogishi A. (2005, Summer). Economic and real estate trends. Retrieved September 1, 2005, from http://www.pmigroup.com/lenders/media_lenders/pmi_eret05v3s.pdf
Historical Housing Price Increases
Respected economist and best selling author Robert Schiller claims that real home price appreciation has averaged 0.4% annually plus inflation from 1950-2004. Schiller’s study accounts for the fact that a house built in 1950 is built very different than a house built in 2004 (sq. footage, features, etc.) (2005). This is the difference between comparing statistically median or average house valuations and any single house. The average single house has grown slower than statistically average house prices (which keeps increasing in size and quality).
For the purpose of objectivity and to confirm Schiller’s findings a separate study is considered. Glaeser, Gyourko & Saks show that US average home prices had risen by 1.7% plus inflation from 1950 through 2000 (2005). However, they clearly state in the paper’s abstract that much of the increase reflects “housing quality”. Their study does not compare the selling prices of a similar quality and size house in 1950 and 2000. It is for this reason the two studies seem fairly closely to each other’s findings, and seem close to accurate.
Schiller’s methodology, in my opinion, closely reflects the average long term annual price increases the owner of a house should expect in the long term: 0.4%, plus inflation, more or less.
Interest Rates and Lending Practices
Falling Interest rates
The largest price/earnings and price/rent valuations of modern history (figures 1 & 2) have coincided with the largest dip in mortgage rates since Freddie Mac began keeping statistics in 1971 (2005). It should not be difficult to imagine how access to more cash via lower mortgage rates can influence a rapid increase in housing prices. However, the increased access to funds does not stop with historically low rates.
Loose Lending Practices
A traditional mortgage requires 20% down. If less is put down, mortgage insurance (MI) is generally required.
In a surprising report for the PMI Group, Charles Calhoun a former senior researcher for Fannie Mae & former Deputy Chief Economist for the Office of Federal Housing Enterprise Oversight makes these observations about new loan products (2005), “Following already impressive growth since 1999, the annual rate of growth in second-lien home equity lending has been estimated at nearly 39 percent for 2004, and is expected to exceed 30 percent in 2005.” (p. 5 ) “Current GSE [Fannie Mae & Freddie Mac] regulatory reporting and risk-based capital standards were developed prior to the rapid growth in the piggyback market, and did not anticipate the significance of the potential risk.”(p. 4)
As a result “First-lien purchasers like Fannie Mae and Freddie Mac may not always know about the existence of simultaneous second liens, much less second liens that are originated at different times or by different primary lenders.” (p. 21)
His story just keeps sounding more like chaos, he claims that as a result of loose regulatory requirements, and the simultaneous second mortgages taken by buyers with little or no money down, that the GSE’s, in addition to being tricked (my interpretation) into making the loan without realizing the existence of a second mortgage, bankers are often qualifying borrowers with no PMI insurance due to the GSE’s impression that there was a significant down payment when there really was none.
Calhoun cautions that “Piggyback loans may contribute to the risk of speculative bubbles in local housing markets by qualifying borrowers for larger loans at higher LTVs, [loan to value] thus initially supporting a rapid rise in housing values, but may ultimately fail in greater numbers, generating higher loss rates in response to declining housing values” (p. 9). Calhoun also makes these observations about new loan products:
- There has been a rapid rise in the amount of high loan-to-value mortgages (over 80% of property value) in recent years.
- There has been a rapid rise in the amount of second-lien mortgages in recent years.
- " Among the MSAs [Metropolitan Statistical Areas] ranked in the top 10 in terms of market risk [he is referring to PMI’s Risk Index as partially shown above in table two], 7 regions had more than half of their mortgage lending for home purchases in piggybacks during the first half of 2004 ..."
- Motivations of bankers to use piggyback loans (second-liens often used for home purchase) include:
a) Additional fees.
b) Non disclosure of second liens in order to fit Fannie Mae, Freddie Mac or other mortgage buyer/investor’s requirements.
c) Salability of riskier loans. (Lower credit scores can be doctored up with two smaller loans.)
d) Salability of high total loan to value (LTV) rate mortgages (above 80%) without mortgage insurance.
- Piggyback loans have altered the historical relationship of mortgage sellers and institutions that invest in these securities.
- Second liens are increasingly being used to increase the marketability of first liens to investors (sometimes without mortgage insurance). These loans would otherwise not meet their credit standards.
- Piggyback loans appear to be much more prevalent in high risk areas as noted in Akkeraen & Ogishi's Risk Index and may contribute to speculation.
- "The risks of high-LTV loans are well documented. In fact, no single factor is more important for predicting the likelihood of mortgage default" (p.15).
- Regulators are increasingly concerned with: interest only loans, reselling of low or no documentation loans, high income/debt ratios, High LTV ratios, lower credit score requirements, appraisal methods, and increased transactions created through brokers, or delegated to other institutions (p.18).
- "The risks of high-LTV loans are well documented. In fact, no single factor is more important for predicting the likelihood of mortgage default" (p.15).
References
Akkeraen, M.V., & Ogishi A. (2005, Summer). Economic and real estate trends. Retrieved September 1, 2005, from http://www.pmigroup.com/lenders/media_lenders/pmi_eret05v3s.pdf
Calhoun, C.A. (2005, June) The hidden risks of piggyback lending. Retrieved September 7, 2005 from http://www.pmigroup.com/newsroom/media_newsroom/hiddenriskspiggyback.pdf
DeKaser R. (2005, July). House prices in America: Valuation methodology & findings. Retrieved September 20, 2005 from http://www.nationalcity.com/content/corporate/EconomicInsight/documents/...
Economagic.com (2005). Series title: 10-year treasury constant maturity. Retrieved September 29, 2005, from http://www.economagic.com/em-cgi/data.exe/fedbog/tcm10y
Economist.com (2005, June). The global housing boom: In comes the waves. Author. Retrieved September, 18, 2005, from Economist.com database
Freddie Mac (2005, September). 30-Year Fixed-Rate Mortgages Since 1971. Retrieved September 30, 2005, from http://www.freddiemac.com/pmms/pmms30.htm
Glaeser, E.L., Gyourko, J., & Saks, R.E. (2005). Why Have Housing Prices Gone Up?. Retrieved September 20, 2005
Greenspan, A. (2005, April). Remarks by Chairman Alan Greenspan. Retrieved October 1, 2005, from http://www.federalreserve.gov/boarddocs/speeches/2003/20030403/default.htm
Lim, Paul J. (2005). Housing's a buy? So why do execs sell?. U.S. News & World Report, 139(9), 58. Retrieved September 18, 2005 from ProQuest database
Malpezzi, S., & Wachter, M. (2000). The role of speculation in real estate cycles. Journal of Real Estate Literature, 13(2), p.143-164. Retrieved July, 5, 2005
Schiller, R.J. (2005). Irrational exuberance: Second edition. Princeton: Princeton University Press